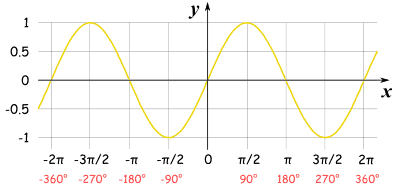
Graph of Sine Function
The Sine Function has this beautiful up-down curve (which repeats every 2π radians, or 360°).
It starts at 0, heads up to 1 by π/2 radians (90°) and then heads down to -1.

Remember that the period of y =sin x is 2π,so after drawing the graph in [0,2π]we can copy the curve any number of times to get the general graph of y=sin x.
Graph of Cosine Function
Cosine is just like Sine, but it starts at 1 and heads down until π radians (180°) and then heads up again.

Remember that the period of y =cos x is 2π,so after drawing the graph in [0,2π]we can copy the curve any number of times to get the general graph of y=cos x.

